|
June 6, 2026 Jeff Asher has created a national CompStat with timely crime data
PERF members, Police chiefs know that addressing crime means, in the words of legendary NYPD crime strategist Jack Maple, getting accurate and timely information into the right hands. Over the past three decades, police leaders have used the NYPD’s CompStat system and similar programs to quickly get their agencies’ crime data to officers and supervisors in the field. But the FBI has been far slower to publish its own national crime data. This longer turnaround time is somewhat understandable, because they must gather data from 17,500 agencies and want to ensure the information’s accuracy before publishing it. But the delay has meant that the field might not know about national crime trends until more than a year after they occur. Jeff Asher saw the need for more timely national crime data and has developed what I think of as a sort of national CompStat system. He developed his data analysis skills with the Central Intelligence Agency (CIA), then worked as a crime analyst for the New Orleans Police Department (NOPD). In 2019, Asher and Ben Horwitz co-founded AH Datalytics, which works with nonprofits and local and state governments to improve data collection, presentation, and analysis. In 2024, Asher and AH Datalytics created the Real-Time Crime Index (RTCI) with support from Arnold Ventures. The RTCI collects FBI Uniform Crime Report (UCR) data from hundreds of agencies to publish national crime statistics months—or even more than a year—before the FBI publishes its crime data. AH Datalytics also tracks shooting data from 30 agencies on a dashboard that’s updated twice daily. And this week they launched the Crime Data Assistant, an AI-powered chatbot that uses the RTCI, the FBI’s historical UCR data, the FBI’s National Incident-Based Reporting System (NIBRS) data, and the FBI’s Supplementary Homicide Reports to answer questions about crime data. Asher has written for FiveThirtyEight and the New York Times, and he publishes multiple blog posts and podcast interviews every week on his Substack, Jeff-alytics. I spoke with Asher on Tuesday about his background, the RTCI, the Agency Shooting Data dashboard, and the Crime Data Assistant. Chuck Wexler: What did you learn while working for the CIA? Jeff Asher: I’m an analyst, so I learned to think and write and analyze and communicate. When they teach you those skills at the CIA, they assume that if you’re assigned to Iranian ballistic missiles, or Chinese military proceedings, or Peruvian leadership, the skill sets are all attributable to any subject matter. So you can use these skills to evaluate different subject matters. Wexler: When did you work for the New Orleans Police Department? What was that like? Asher: 2013 to 2015. It was very interesting. The consent decree had just gone into effect, and they were doing a lot of interesting and impactful gun violence reduction programs. At the same time, they hadn’t had a crime analyst there in decades. They didn’t really know what to do with a crime analyst. So it was interesting. It was a way to sort of get my feet wet in this world, but it didn’t feel like the most impactful career step that I’ve ever had. Wexler: How did you get the idea for the Real-Time Crime Index? Asher: I left NOPD in 2015, a little less than two years after starting. I was opening my own consultancy. My challenge was that I’d worked for the CIA and NOPD—these large, faceless bureaucracies—and I didn’t have any sort of public persona in any way. And if you want to have a consultancy, people have to know who to hire. I started my own blog where I was taking publicly available data and analyzing it. Then I got connected with Nate Silver at FiveThirtyEight and was fortunate enough to start freelancing there. That was back in 2015 and 2016, when you saw huge jumps in murder in Chicago, Baltimore, and New Orleans, so I started writing about that. Part of the challenge was that the FBI is so slow. Historically, the FBI was taking until September or October of the following year to publish the previous year’s data. The workaround I figured out was that, thanks to the Obama administration’s Police Data Initiative, agencies were suddenly publishing this information. They weren’t all publishing it in the same way. They weren’t all publishing it in the same time frame. But if you collected enough of it, you could get really close to predicting the national trend. I started with a Google sheet of 25 agencies I collected murder data from regularly, and it grew and it grew and it grew. The idea behind the Real-Time Crime Index was, what if you collected enough agencies’ data for it to be very highly predictive, and you built the back end to standardize what was being collected and how frequently. So you’re not just saying, “Murders are down X percent, we think.” You could say that across every crime and could say it reliably, with really fast turnaround that doesn’t wait for the FBI. So if murder is down 14.8 percent and we’re saying it’s down 15.4 percent, that’s really great. We’re accurate. So that was the genesis, and I pitched it to Arnold Ventures and they loved it. Wexler: How many agencies do you now collect data from? Asher: We had 580 in December, and I think our most recent update had around 560. Wexler: How could a police chief use your information? Asher: I think there are a couple of really important and impactful ways that chiefs can use it. First of all, you can use it as a barometer. How are you doing? You remember in 2022, that video hit TikTok about how to steal certain models of cars. It felt like every police department in the country had an enormous skyrocketing of auto thefts. One approach is to view that in a vacuum: We’re having this doubling of auto thefts almost overnight. We’ve got a huge problem. Another approach is to look at it in terms of the national or big city or medium city trend. We’re seeing this trend. It’s clearly part of something bigger. That doesn’t excuse the crime that is happening, but maybe there’s something other chiefs are seeing, and I could reach out to them. We are also an audit on improper data being submitted to the FBI. There’s an agency we went to and said, “We’re getting your data from the state. You’re clearly not reporting the correct data to the state. Are you able to send us corrected data?” They said, “We’re doing what now?” They had not realized that they were sending incorrect data up to the state. They didn’t realize there was a problem. They looked and there were thousands upon thousands of reports in their system that were backlogged and were not being approved by supervisors. So we saw this, we went to them, and they said, “We have a problem.” They fixed the problem, and then they talked about the problem being fixed. So they came at the problem before some enterprising member of the press discovered that they were clearly making some sort of error. It was proactive—this was a problem, now we fixed it. Wexler: What additional information from police departments would help your efforts? Asher: For agencies we don’t have data for, we’d love participation. And we’d love to hit as many states as possible. I think we have 47 states that are sending us data. So if anybody in Portland, Maine, wants to participate, I’d love to chat with you. We get data from a couple dozen agencies directly, but for the most part, we get it from states, the FBI, and public portals. When this project started, I thought we’d have to go make a relationship with every agency in the country. It turns out a lot of the data is just sort of sitting there in ways that are accessible. Wexler: How quickly are you publishing information? Asher: We’re on a 45-day lag. So two weeks ago, in mid-May, we published the March data. And in mid-June, we’ll publish the April data. And if you go back through our historical data, you can see how well our sample predicts the national trends, even at this point of the year. We’re at the point, in June, where you can start making really strong predictions about what 2026’s crime statistics will look like. You’re making some guesswork and analysis, but we can pretty much predict what this year’s murder rate is going to be, instead of having to wait until September 2027. Wexler: How has artificial intelligence changed your day-to-day work of collecting and analyzing data? Asher: For our work, it’s a game changer. When we started the Real-Time Crime Index, it was 99 percent manual. We went out and got data. We’d go to the state of Texas’s website and pull each agency individually. It took a day or two days or three days to put it together, then we audited it. Now I think there are three agencies that are not automated. So it’s five or six button clicks, then it produces a document that is auditable. We’ve told the AI that if it’s off this number of standard deviations from the last 12 months, that suggests there’s possibly underreporting. It identifies those agencies, then a person on the team can go through them. So it’s five button clicks, then a 30-minute spreadsheet review to weed out any underreporting. All that is built by AI. We’re able to do the scrapes, the ingestion, identify what needs auditing, and then publish it. All that is automated at this point through AI. Wexler: Tell me about your shooting tracker dashboard. Asher: Obviously shooting data is really hard. Agencies often don’t collect it or don’t publish it. It’s not something the FBI mandates. You have aggravated assault with a firearm. You have firearm murder. But you don’t have to report nonfatal shootings. The idea behind the dashboard was to go out and find which agencies are actually publishing this data live. I found 30 agencies nationwide, ranging from Chicago to Albany, New York, that publish the data in a way that is trackable. Sometimes it’s daily. Chicago publishes a daily file that has shooting victim–level data. So you can see information—not personal information—on who the victim was. We can aggregate all of that.
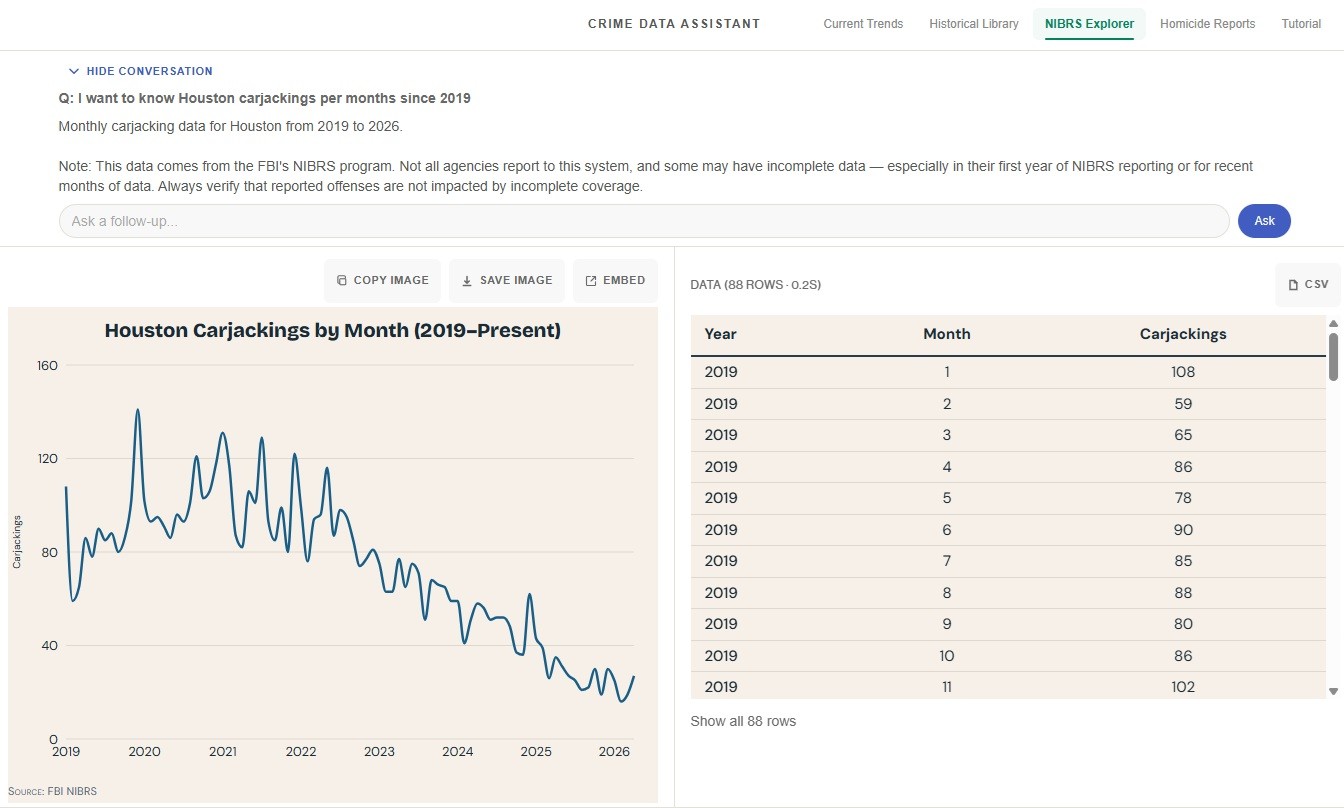
The 30 agencies in the Agency Shooting Data dashboard report a 13.9 percent drop in shootings so far in 2026. Source: AH Datalytics Some places, like Memphis or Milwaukee or New Orleans, publish incident-level data or aggregated data. Some places do it daily, some places do it weekly, some places do it monthly. We gather all that and, from 30 agencies, we can tell what the percent change in shootings is. And then we can publish it. Using Claude, we built 30 different scrapers. The scrapers work every day, twice a day. They go out, get the data, and publish it. By aggregating all of that, now we’re not talking about a 45-day lag; we’re basically talking about zero lag for evaluating the gun violence trend in the country from many of the largest police departments. Wexler: This week you unveiled the Crime Data Assistant, which is a crime data chatbot you’ve been building. How could that be helpful to police chiefs? Asher: It has the Real-Time Crime Index data. It has the FBI’s Supplementary Homicide Report data. It has historical data—we actually scraped old FBI PDFs going back to the 1930s to get staffing and crime data, as well as clearance data back to the 1960s. It also has NIBRS data. It started with me wanting to be able to query carjackings. Carjackings are not something that every agency collects, but in NIBRS, a carjacking is a robbery where a vehicle was stolen. So under NIBRS, we can actually track carjacking systemically across agencies. The assistant grew from there. The idea is that whatever crime data you’re interested in from these sources, it can tell you. So if you want to know about carjackings or vehicle burglaries or intimidation assaults, these are things that NIBRS collects, but NIBRS is enormous. There are a billion rows of NIBRS data collected since 1991. This allows you to query it in natural language. “I want to know Houston carjackings per month since 2019.” There’s a chart, there’s a table.
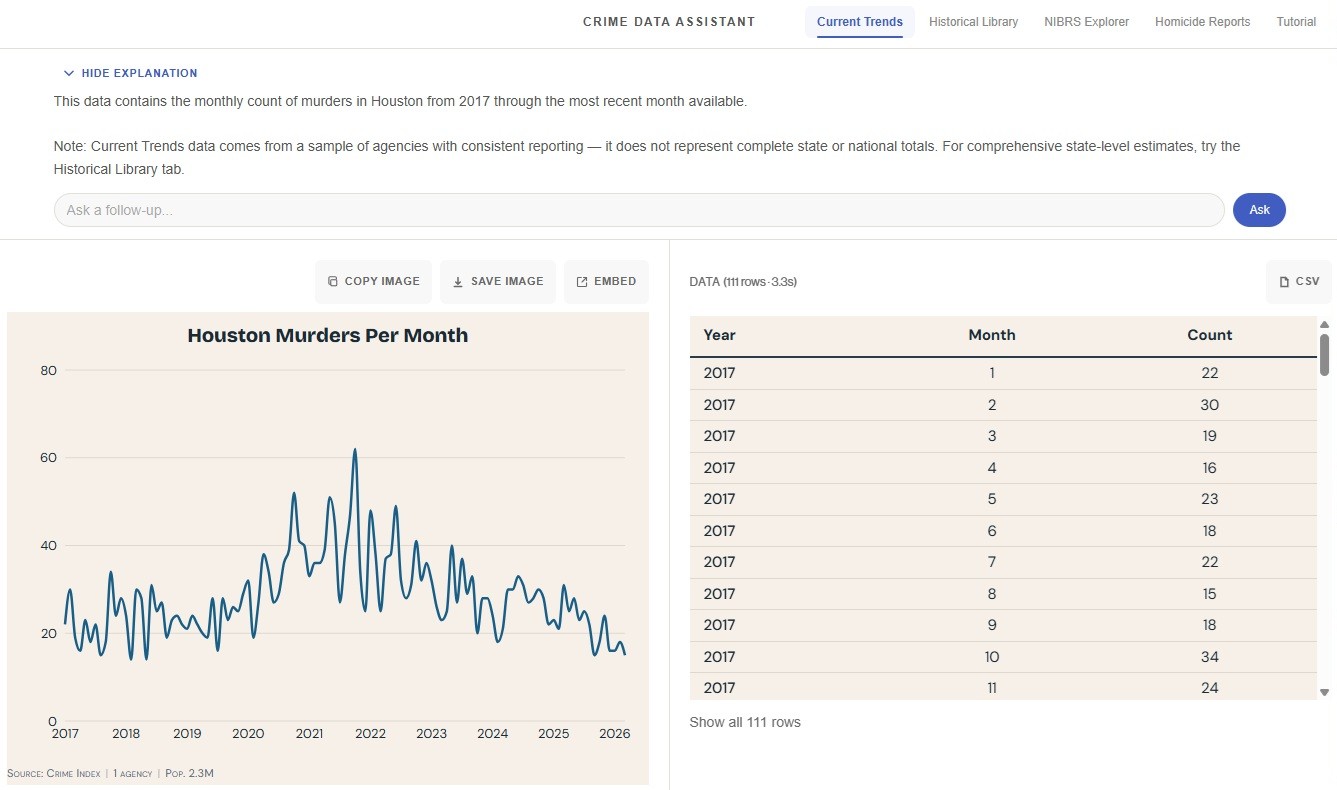
The Crime Data Assistant’s response to “I want to know Houston carjackings per months since 2019.” Source: AH Datalytics Crime Data Assistant You can query the Real-Time Crime Index with “I want to know Houston murders per month from 2017 through the most recent month.” There it is.
The Crime Data Assistant’s response to “I want to know Houston murders per month from 2017 through the most recent month.” Source: AH Datalytics Crime Data Assistant “I want to know how many police officers Houston had in the 1940s.” You can do that. Or how many murders Houston had per year since the 1930s. Or you want to know, of Houston’s murders, what share of them were intimate partner or domestic or with a firearm. You can do that. The idea is to make it so that any question that anybody has that has available data is answerable. I released it on Substack. I’m now getting lots of queries and working through bugs, because it’s AI, it’s not perfect, and there are ways to improve it. Wexler: CompStat was developed in response to agencies not getting their own crime information in a timely manner, and this strikes me as a sort of national CompStat. Have you thought of it that way? Asher: That’s a lot of pressure. I think of it in baseball terms, like it’s essentially a national scoreboard. These systems are not standardized in terms of what’s publicly reported when. Understanding what’s happening as it’s happening has always sort of been the golden goose that we’re chasing. And I think we’ve had some success in creating these things. Now it’s just a matter of continuing and growing and further standardizing them. Wexler: What’s the trend in murders so far this year? Asher: In 2024, we were roughly where we were in 2019. Then the evidence was clear, even at this point last year, that we were having an enormous drop in 2025. We were doing the back-of-the-napkin math and saying that if the drop continued—which it ended up doing—we were probably looking at about 14,000 murders, which is the fewest murders in 50 years and the lowest murder rate ever recorded. All the evidence we have right now, from the FBI’s first look and the CDC data coming in, points to that holding up. Then it’s dropping again this year, in 2026. I don’t know that we can say exactly how far it’ll fall in 2026, but it certainly points to another huge drop that blows away the record set last year for the lowest murder rate ever recorded. It’s the lowest number of murders since the mid-to-late ‘60s, when the country’s population was much smaller.
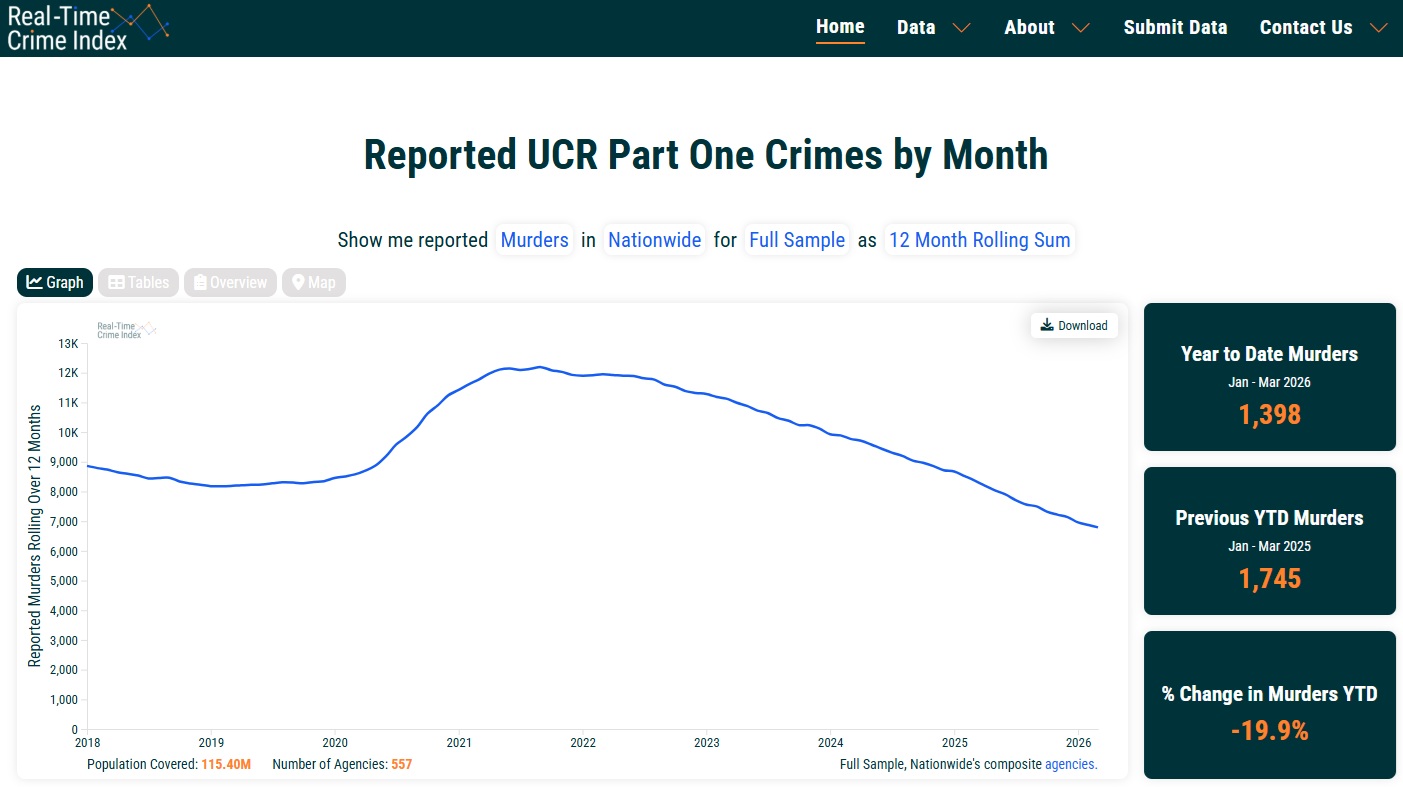
The Real-Time Crime Index reports a 19.9 percent drop in murders through the first three months of the year. Source: AH Datalytics Real-Time Crime Index Thanks to Jeff for taking the time to speak with me, and for providing such a valuable service to the field! He and his team have done something remarkable by pulling together crime data from more than 500 agencies to identify emerging trends with only a 45-day lag. Agencies can now compare their crime data against other cities’ and determine which trends are local and which may be national. Police chiefs have been identifying crime patterns in a timely fashion in their own cities for decades, and now they can identify national trends. I strongly encourage you to try out the Crime Data Assistant and subscribe to Jeff-alytics on Substack. Best, Chuck |